Note
Go to the end to download the full example code.
Move and Rotation#
This example demonstrates moving and rotating the spatial boundary of a logical qubit.
Rotating the boundary types of a logical qubit is a crucial operation in lattice surgery. For instance, merging two logical qubits requires their boundary types to be aligned. Therefore, performing such boundary-type rotations is often essential to facilitate seamless lattice merging.
Construction#
tqec provides the builtin function tqec.gallery.move_rotation to construct it.
from multiprocessing import cpu_count
from pathlib import Path

import matplotlib.pyplot as plt
import numpy
import sinter

from tqec import Basis, NoiseModel, compile_block_graph
from tqec.gallery import move_rotation
from tqec.simulation.plotting.inset import plot_observable_as_inset
from tqec.simulation.simulation import start_simulation_using_sinter
graph = move_rotation()
graph.view_as_html()
This operation rotates the orientation of the logical observable through a spatial L-shape junction. As shown below, the correlation surface initially aligns with the Y-axis and finally aligns with the X-axis.
correlation_surfaces = graph.find_correlation_surfaces()
graph.view_as_html(
    pop_faces_at_directions=("-Y",),
    show_correlation_surface=correlation_surfaces[0],
)
Example Circuit#
Here we show an example circuit of move rotation with \(d=3\) surface code
that is initialized and measured in the \(X\) basis. You can download the
circuit here
or view it in Crumble.
graph_x = move_rotation(Basis.X)
compiled_graph = compile_block_graph(graph_x)
circuit = compiled_graph.generate_stim_circuit(
    k=1, noise_model=NoiseModel.uniform_depolarizing(p=0.001)
)
Simulation#
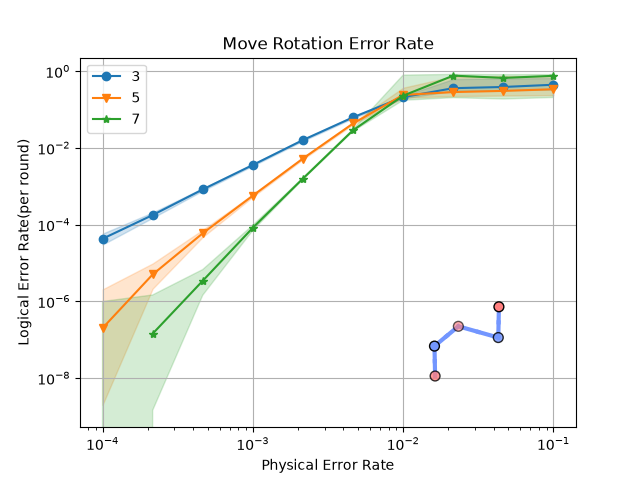
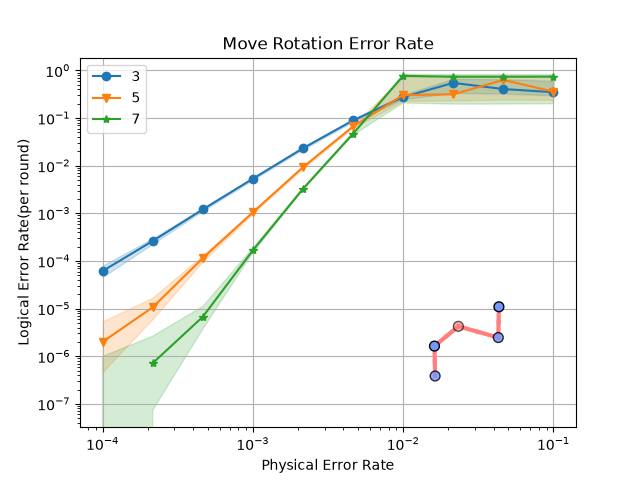
Here we show the simulation results of both $X$-basis and $Z$-basis experiments under a uniform depolarizing noise model.
def generate_graphs(support_observable_basis: Basis) -> None:
    """Generate the logical error-rate graphs corresponding to the provided basis."""
    block_graph = move_rotation(support_observable_basis)
    zx_graph = block_graph.to_zx_graph()

    surfaces = block_graph.find_correlation_surfaces()

    stats = start_simulation_using_sinter(
        block_graph,
        range(1, 4),
        list(numpy.logspace(-4, -1, 10)),
        NoiseModel.uniform_depolarizing,
        manhattan_radius=2,
        observables=surfaces,
        num_workers=cpu_count(),
        max_shots=1_000_000,
        max_errors=5_000,
        decoders=["pymatching"],
        save_resume_filepath=Path(
            f"../_examples_database/move_rotation_stats_{support_observable_basis.value}.csv"
        ),
        database_path=Path("../_examples_database/database.pkl"),
    )

    for i, stat in enumerate(stats):
        _, ax = plt.subplots()
        sinter.plot_error_rate(
            ax=ax,
            stats=stat,
            x_func=lambda stat: stat.json_metadata["p"],
            failure_units_per_shot_func=lambda stat: stat.json_metadata["d"],
            group_func=lambda stat: stat.json_metadata["d"],
        )
        plot_observable_as_inset(ax, zx_graph, surfaces[i])
        ax.grid(axis="both")
        ax.legend()
        ax.loglog()
        ax.set_title("Move Rotation Error Rate")
        ax.set_xlabel("Physical Error Rate")
        ax.set_ylabel("Logical Error Rate(per round)")
Z Basis and X Basis Simulations
Total running time of the script: (2 minutes 20.913 seconds)